Sunday, December 21, 2008

SPSS: programing SPSS with Python (part 1)

SPSS is a data mining and statistical analysis software. Resent versions (v14 - v17) allow to use Python to control SPSS. This can be quite handy, especially if there are lots of variables and lots of data files to analyze and such analysis is often repeated. In such a case, writing some script in Python that can execute SPSS analysis automatically can save you lots of time. This is the first post out of three, which will present some example of using Python and SPSS together. First, let me present what soft and hardware I have:
  • Intel Mac X 10.4.11
  • SPSS 16.0.1 with SPSS-Python Integration Plug-In
  • Python 2.5

Check if SPSS-Python Integration Plug-In works

Before we can proceed any further we have to check if SPSS-Python Integration Plug-In is working, and we can control SPSS using Python. To do this I usually use the following procedure:
1. Start SPSS.
2. Create new script (File->New->Script):
This results in a python IDLE console:
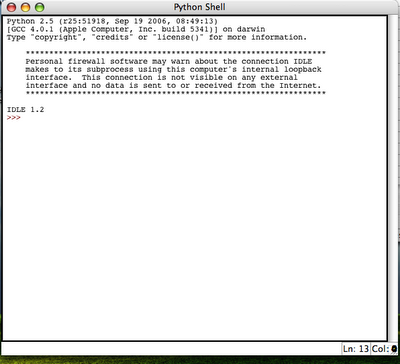
3. Try to import spss library and execute some simple spss function (e.g. spss.GetVariableCount()):
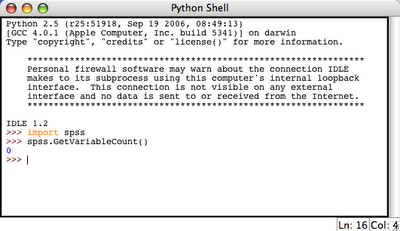
This resulted in 0 which is OK, because we do not have any active dataset.

So it appears that SPSS-Python union is working. Therefore, we can do something useful now.

Note

More information on SPSS-Python programming along with examples can be found in SPSS Programming and Data Management.

Thursday, December 18, 2008

Blogger: uploading files to blogger posts

By default you can upload only image or movie files into your blogger posts. To upload anything else, such as a zip file, music file it is necessary to have some host server that can store the files. Once the files are stored on a host, you can put a link to a file. So the question is where I can host my files - preferably for free. For me, the answer are Google sites. The reason is that it allows you to create five websites each containing up to 100 MBs of stuff. You can upload files there in a form of attachments or as so-called File Cabinet:Once the File Cabinet is created user can upload some files. And the links to these files can be posted in your blog post.

Example

As an example I have upload an zip file that contains SyntaxHighlighter 1.5.1 with simple index.html demo code snippets. The zip file is here.

Wednesday, December 17, 2008

Python: Ellipse fitting

The algorithm below fits an ellipse into the polygon (or set of points) in such a way that the area of the ellipse fitted is equal to the area of the polygon. from __future__ import division

from scipy import *
import pylab as p


def ellipse(ra,rb,ang,x0,y0,Nb=50):
'''ra - major axis length
rb - minor axis length
ang - angle
x0,y0 - position of centre of ellipse
Nb - No. of points that make an ellipse

based on matlab code ellipse.m written by D.G. Long,
Brigham Young University, based on the
CIRCLES.m original
written by Peter Blattner, Institute of Microtechnology,
University of
Neuchatel, Switzerland, blattner@imt.unine.ch
'''
xpos,ypos=x0,y0
radm,radn=ra,rb
an=ang

co,si=cos(an),sin(an)
the=linspace(0,2*pi,Nb)
X=radm*cos(the)*co-si*radn*sin(the)+xpos
Y=radm*cos(the)*si+co*radn*sin(the)+ypos
return X,Y

def _makexy(scale):
x=reshape(array(range(scale*2)*(scale*2)),(scale*2,scale*2))
return x,x.T

def _inside2(x,y,px,py):
'''Check if point (x,y) inside polygon deifined by (px,py).
From: http://www.ariel.com.au/a/python-point-int-poly.html
'''
poly=zip(px,py)
n = len(poly)
inside =False
p1x,p1y = poly[0]
for i in range(n+1):
p2x,p2y = poly[i % n]
if y > min(p1y,p2y):
if y <= max(p1y,p2y):
if x <= max(p1x,p2x):
if p1y != p2y:
xinters = (y-p1y)*(p2x-p1x)/(p2y-p1y)+p1x
if p1x == p2x or x <= xinters:
inside = not inside
p1x,p1y = p2x,p2y
return inside

def _polyMask(X,Y,rs):
'''Make binary mask of polygon. Values of one
in 2D array pd represents points enclosed by the polygon.'''
pd=zeros((rs*2,rs*2))
for i in range(pd.shape[0]):
for j in range(pd.shape[1]):
if _inside2(i,j,X,Y)==True:
pd[i,j]=1.0
return pd

def ellfit(X,Y,rs=50,showFig=True):
'''Fit and ellipse to a polygon defined by X,Y in such a way
that area of the ellispe fitted is the same as area of the polygon.
Based on ellfit.pro by D.G. Long, Brigham Young University.
Conditions:
1. The polygon must not be self intersecting.
2. Polygon must be closed (last point must match the first one).
3. Polygon must be centered in (0,0)
4. Polygon must be within rectangle <-1,1>x<-1,1>
'''

#Xmax,Ymax=abs(X).max(),abs(Y).max()
#X=X/Xmax
#Y=Y/Ymax

pi2=2*pi
rs2=2*rs
if showFig:
fig = p.figure(figsize=(5,5))
ax = fig.add_subplot(111)
X=X*rs+rs
Y=Y*rs+rs

xa,ya=_makexy(rs)

pd=_polyMask(X,Y,rs)

if showFig:
p.plot(X,Y,"rs-",ms=15)
for i in range(pd.shape[0]):
for j in range(pd.shape[1]):
if pd[i,j]==1.0:
pass
p.plot([i],[j],'g.',ms=10)


m00=pd.sum()

m10=(xa*pd).sum()
m01=(ya*pd).sum()

xm,ym=m10/m00, m01/m00

u20=(xa*xa*pd).sum()-xm*m10
u02=(ya*ya*pd).sum()-ym*m01
u11=(xa*ya*pd).sum()-ym*m10

tn2=2*u11/(u20-u02)

ang=arctan(tn2)/2.0

if u02>u20:
ang=ang-pi/2

xmean,ymean=X.mean(),Y.mean()

Xr = cos(ang) * (X-xmean) - sin(ang) * (Y-ymean) +xmean
Yr = sin(ang) * (X-xmean) + cos(ang) * (Y-ymean) +ymean

t=_polyMask(Xr,Yr,rs)

m00=t.sum()
m10=(xa*t).sum()
m01=(ya*t).sum()

xm,ym=m10/m00, m01/m00

u20=(xa*xa*t).sum()-xm*m10
u02=(ya*ya*t).sum()-ym*m01
u11=(xa*ya*t).sum()-ym*m10

aa=((16*u20**3)/(pi2*u02))**(1/8)
bb=((16*u02**3)/(pi2*u20))**(1/8)

##ellispe params
a,b=max([aa,bb]),min([aa,bb])
b=t.sum()/(pi*a)
ecc=sqrt(a**2-b**2)
theta=ang
ellArea=pi*a*b
print "Ploygon_area - ellispe_area = ",round(ellArea-t.sum(),3)

#print time.time()-t1
if showFig:
p.grid(True)
p.show()

#xee,yee=b/rs*cos(0),a/rs*sin(0)
#b3,a3=xee*max([Xmax,Ymax])/cos(theta),yee*min([Xmax,Ymax])/sin(theta)
#print b3/a3, b/a

return a/rs,b/rs,ecc,theta


def elltest(scale=0.8,off=0.2):
#generate an example, random, non-self-intersecting polygon.
#This is done by first generating
#it in polar coordinates and than translating it
#to cartesian.
Theta1,R1=linspace(0,2*pi,30),rand(30)*scale+off
X1,Y1=R1*cos(Theta1),R1*sin(Theta1)
X1=append(X1,X1[0])
Y1=append(Y1,Y1[0])

p.plot(X1,Y1,".-",ms=10)


a2,b2,ecc2,alpha2=ellfit(X1,Y1,showFig=False)

Xe,Ye=ellipse(b2,a2,-alpha2,X1.mean(),Y1.mean(),Nb=40)

p.plot(Xe,Ye,"r.-")


p.grid(True)
p.show()
pass


if __name__ == '__main__':
elltest()

Examples


Note 1

The algorithm has the following limitations:
  • The polygon must not be self intersecting.
  • Polygon must be closed (last point must match the first one).
  • Polygon must be centered in (0,0)
  • Polygon must be within rectangle <-1,1>x<-1,1>

Note 2

This algorithm could be modified to overcome the above (Note 1) limitations. However, at the very moment I don't have time to do this. Hope this is not a problem.

Note 3

Searching the Internet for an ellipse fitting script for Python I found fitellipse.py. It is very useful, however, sometimes I got an Exception that its not possible to fit an ellipse. The algorithm presented here seems to work good. In case the ellipse cannot be fitted try to increase rs attribute of ellfit function. The default value is 50 (rs=50).

Note 3

This script is in ellipsefit.py.

Sunday, December 14, 2008

Some free, essential e-books

I have just found some free e-books source on www.techotopia.com. There are books such as:
  • JavaScript essentials
  • Ruby essentials
  • PHP essentials
  • MySQL essentials
  • Xen essentials
  • and more.

Tuesday, December 09, 2008

SciTE: customize it

SciTE is very nice little text editor. I constantly use it, but it's default layout settings are not good for me. However, it allows to create, so called User Option File (/home/me/.SciTEUser.properties) and adjust it to user's preferences. This is what I have in this file:split.vertical=0
line.margin.visible=1
line.margin.width=4
position.width=650
position.height=920
output.vertical.size=175
With these settings the editor looks as follows:

Wednesday, December 03, 2008

ubuntu: mount windows share

I had ubuntu 8.10.
First I had to install samba and smbfs. Than I created mount point /home/me/ub1 and used the commadsudo mount -t cifs -o username=myusername,password=mysecretpass,rw,uid=1000,gid=1000 //iptoshare/sharename /home/me/ub1

Tuesday, December 02, 2008

Python: use Cython to make it faster

Just as an example, I present some function that I translated to Cython. I also show how big the change in speed of my application was. The function is a part of an image processing application and it analyzes a given image on pixel by pixel basis. There are four nested loops! in this function. For this reason the function is very time consuming. The original code was:def calculateVar(self):
N=self.N;
I=self.ima

[ans,xoffs,yoffs,dists]=self.getSearchRegion()
noOfAngles=int(ans.shape[0])

self.ROTs=zeros(xoffs.shape)

diffMtx_size=N*N/self._jump/self._jump
diffMtx=zeros(diffMtx_size,dtype=int)

for ai in range(noOfAngles):
for offi in range(xoffs.shape[1]+0):

diffMtx.fill(0)
ind=0;

xoff=xoffs[ai,offi]
yoff=-yoffs[ai,offi]

for y1 in range(0,I.shape[0],self._jump):
for x1 in range(0,I.shape[1],self._jump):
x2=x1+xoff
y2=y1+yoff

if x2>=N or y2>=N or x2<0 ind="ind+1" diffmtx2="diffMtx[diffMtx">0]
self.ROTs[ai,offi]=diffMtx2.var()

This function was change to the following one:def calculateVar(self):
N=self.N;
I=self.ima
I2=array(I,dtype=int)
[ans,xoffs,yoffs,dists]=self.getSearchRegion()

#this is part in Cython!
self.ROTs=loopcore.loopcore(I2,ans.shape[0],xoffs.shape[1],
array(xoffs,dtype=int),array(yoffs,dtype=int),
N, self._jump)

where loopcore is a Cython module loopcore.pyx as follows:import numpy as np
cimport numpy as np

DTYPE = np.int
ctypedef np.int_t DTYPE_t
ctypedef np.float_t DTYPE_t2

cdef inline int int_abs(int a, int b): return abs(a-b)

def loopcore(np.ndarray[DTYPE_t, ndim=2] I,int noOfAngles,
int noOfpixels, np.ndarray[DTYPE_t, ndim=2] xoffs,
np.ndarray[DTYPE_t, ndim=2] yoffs,
int N, int jump ):

cdef int y1,x1,x2, y2, ind,ai,offi, xoff,yoff,array_size

array_size=N*N/jump/jump

cdef np.ndarray[DTYPE_t, ndim=1] p= np.zeros(array_size, dtype=DTYPE)
cdef np.ndarray[DTYPE_t, ndim=1] p2= np.zeros(0, dtype=DTYPE)
cdef np.ndarray[DTYPE_t2, ndim=2] ROTs= np.zeros([noOfAngles,noOfpixels], dtype=np.float)

for ai in range(noOfAngles):
for offi in range(noOfpixels):
p.fill(0)
ind=0
xoff=xoffs[ai,offi]
yoff=-yoffs[ai,offi]
for y1 in range(0,N,jump):
for x1 in range(0,N,jump):
x2=x1+xoff
y2=y1+yoff

if x2>=N or y2>=N or x2<0 ind="ind+1" p2="p[p">0]
ROTs[ai,offi]=p2.var()
return ROTs

The gain in speed was huge. Execution of this function in Python takes about 2.10 min, while using Cython it takes about 0.05 min, i.e. code in Cython is 40+ times faster than that in Python. I'm sure that it can be made even faster than that!


Note 1
I noticed that the more variables is defined (cdef, int, float, ...) the greater the gain in speed is achieved.

Note 2
In Ubuntu 8.04 and 8.10 I compiled the Cython pyx files without any problems using the following command: cython loopcore.pyx gcc -shared -pthread -fPIC -fwrapv -O2 -Wall -fno-strict-aliasing -I/usr/include/python2.5 -o loopcore.so loopcore.c
Note 3
When running any python code from this post, remember to correct code indentations.

Wednesday, November 26, 2008

Python: draw an ellipse

The following Python script draws an ellipse.
from numpy import linspace
from scipy import pi,sin,cos


def ellipse(ra,rb,ang,x0,y0,Nb=50):
'''ra - major axis length
rb - minor axis length
ang - angle
x0,y0 - position of centre of ellipse
Nb - No. of points that make an ellipse

based on matlab code ellipse.m written by D.G. Long,
Brigham Young University, based on the
CIRCLES.m original
written by Peter Blattner, Institute of Microtechnology,
University of
Neuchatel, Switzerland, blattner@imt.unine.ch
'''
xpos,ypos=x0,y0
radm,radn=ra,rb
an=ang

co,si=cos(an),sin(an)
the=linspace(0,2*pi,Nb)
X=radm*cos(the)*co-si*radn*sin(the)+xpos
Y=radm*cos(the)*si+co*radn*sin(the)+ypos
return X,Y

def test():
import pylab as p

fig = p.figure(figsize=(5,5))
p.axis([-3,3,-3,3])

#eg 1
X,Y=ellipse(2,1,pi*2.0/3.0,0,1)
p.plot(X,Y,"b.-",ms=1) # blue ellipse

#eg 2
X,Y=ellipse(2,0.2,pi/3.0,1,1)
p.plot(X,Y,"r.-",ms=1) # red ellipse

#eg 3
X,Y=ellipse(1,1,pi/3.0,-1,1,Nb=16)
p.plot(X,Y,"g.-",ms=1) # green ellipse

p.grid(True)
p.show()


if __name__ == '__main__':
test()

Note

The script is in ellipse.py.

Wednesday, November 05, 2008

Python: os.system returns 32512

The os.system() function executes operating systems's command. When the functin returns code 32512, it means that the command has not been found. One way to make it work, is to use the full path to the command.
En example:

Wednesday, October 22, 2008

Matlab: passing Cell into ansi C mex file

Let the test cell defined in matlab betest_cell={1,[2,3],[5,6,7;8,9,10;11,12,13]};

To get these values in mex C file we can write in functionvoid mexFunction( int nlhs, mxArray *plhs[],
int nrhs, const mxArray *prhs[] ) {

const mxArray* temp_cell;
mxArray* cells[3];

temp_cell=prhs[0]; //cell is the only variable
//passed to mex file.
cells[0]=mxGetCell(temp_cell,0);
cells[1]=mxGetCell(temp_cell,1);
cells[2]=mxGetCell(temp_cell,2);

mexPrintf("%f,", *mxGetPr(cells[0]));
mexPrintf("\n{%f,%f}", *mxGetPr(cells[1]),
*(mxGetPr(cells[1])+1));

int N;
N= mxGetM(cells[2]);
double **Img = makeMatrixFromVector(mxGetPr(cells[2]),N);


int i,j;
for (i=0;i<N;i++) {
mexPrintf("\n");
for (j=0;j<N;j++) {
mexPrintf("\t%.1f ",Img[i][j]);
}
}
mexPrintf("\n")


}

This should give in matlab console:1.000000,
[2.000000 3.000000]
5.0 6.0 7.0
8.0 9.0 10.0
11.0 12.0 13.0

makeMatrixFromVector is defined as follows:double ** makeMatrixFromVector(double *inData,int size) {
int x,y;
double ** Img = (double**)mxMalloc(size*sizeof(double*));
for (y=0 ; y< size ; y++) {
Img[y]=(double*) mxMalloc((size)* sizeof(double));
for (x=0 ; x< size ; x++) {
Img[y][x]=*(inData+x*size+y);
}
}
return Img;
}

Monday, September 22, 2008

sed: substitute text examples

En example

Substitute text1 with text2 in file /etc/apt/sources.list:
cat /etc/apt/sources.list | sed 's/text1/text2/g' > out.txt
or with different 'slash':cat /etc/apt/sources.list | sed 's|text1|text2|g' > out.txt
Multiple substitution: cat /etc/apt/sources.list | sed -e 's/text1/text2/g' -e 's/text3/text4/g' > out.txt

Delete lines containing 'blabla' string:cat some.txt | sed -e '/blabla/d' > out.txt

Sunday, August 24, 2008

VirtualBox: backup VDI using clonevdi tool

To list virtual drives:
VBoxManage list hdds
You must get UUID of virtual drive you want to clone. As an egzamples lets assume that UUID is 973b3243-8168-41c3-bb29-1c9865eaec7c. Having this, one executes clonevdi command as follows:
VBoxManage clonevdi 973b3243-8168-41c3-bb29-1c9865eaec7c outfilename.vdi I noticed that when coping VDI to new Vbox, networking does not work good.
I managed to repair this by restarting it (my guest is Linux):
/etc/init.d/networking restart
Also sometimes this failed, because the command was restarting wrong network interface, e.g. eth4 instead of eth2. This can be change in /etc/network/interfaces

Tuesday, August 12, 2008

ubuntu-server: How to enabling public_html folder

To enable public_html folder in users home directory use the following:sudo a2enmod userdir

Saturday, June 21, 2008

Python: Isotropic fractal surface generator

#! /usr/bin/env python
from __future__ import division
import Image
from scipy import *

class FractalSurface(object):
'''Generate isotropic fractal surface image using
spectral synthesis method [1, p.]
References:
1. Yuval Fisher, Michael McGuire,
The Science of Fractal Images, 1988
'''

def __init__(self,fd=2.5, N=256):
self.N=N
self.H=1-(fd-2);
self.X=zeros((self.N,self.N),complex)
self.A=zeros((self.N,self.N),complex)
self.img=Image.Image()

def genSurface(self):
'''Spectral synthesis method
'''
N=self.N; A=self.A
powerr=-(self.H+1.0)/2.0

for i in range(int(N/2)+1):
for j in range(int(N/2)+1):

phase=2*pi*rand()

if i is not 0 or j is not 0:
rad=(i*i+j*j)**powerr*random.normal()
else:
rad=0.0

self.A[i,j]=complex(rad*cos(phase),rad*sin(phase))

if i is 0:
i0=0.0
else:
i0=N-i
if j is 0:
j0=0.0
else:
j0=N-j

self.A[i0,j0]=complex(rad*cos(phase),-rad*sin(phase))


self.A.imag[N/2][0]=0.0
self.A.imag[0,N/2]=0.0
self.A.imag[N/2][N/2]=0.0

for i in range(1,int(N/2)):
for j in range(1,int(N/2)):
phase=2*pi*rand()
rad=(i*i+j*j)**powerr*random.normal()
self.A[i,N-j]=complex(rad*cos(phase),rad*sin(phase))
self.A[N-i,j]=complex(rad*cos(phase),-rad*sin(phase))

itemp=fftpack.ifft2(self.A)
itemp=itemp-itemp.min()
self.X=itemp


def genImage(self):
#Aa=abs(Aa)
Aa=self.X
im=Aa.real/Aa.real.max()*255.0
self.img=Image.fromarray(uint8(im))
#img2=Image.fromstring("L",(N,N),uint8(im).tostring())

def showImg(self):
self.img.show()

def saveImg(self,fname="fs.tiff"):
self.img.save(fname)

def getFSimg(self):
return self.img

def main():
fs=FractalSurface()
fs.genSurface()
fs.genImage()
fs.saveImg()
fs.showImg()

if __name__ == '__main__':
main()

Example


FD=2.1


FD=2.5


FD=2.9

Tuesday, June 03, 2008

ubuntu: iptables port redirect

I want to redirect all incoming requests on port 80 to 8080. I did it using the following command:sudo iptables -A PREROUTING -t nat -i eth0 -p tcp --dport 80 -j REDIRECT --to-port 8080
Following this operation my iptables -L wasChain INPUT (policy ACCEPT)
target prot opt source destination

Chain FORWARD (policy ACCEPT)
target prot opt source destination

Chain OUTPUT (policy ACCEPT)
target prot opt source destination

The iptables -t nat -L was:Chain PREROUTING (policy ACCEPT)
target prot opt source destination
REDIRECT tcp -- anywhere anywhere tcp dpt:www redir ports 8080

Chain POSTROUTING (policy ACCEPT)
target prot opt source destination

Chain OUTPUT (policy ACCEPT)
target prot opt source destination

I saved these setings using sudo iptables-save.

Note:
This works only when some other computer tries to connect to port 80. If I tried to connect from the same server (i.e. localhost) it did not work. The reason for now is unknown, but it works, an this is good.

Thursday, April 10, 2008

bash: simple loop through files

for f in *.tiff ; do echo $f; done
Example with ImageMagick's convert program: for f in *.tiff; do convert -crop 384x384+48+35 $f out/$f; done

Wednesday, March 26, 2008

Two buttons and scroll in mouse in mac os 8.6

Please install this soft:

GameSprockets_1.7.5.smi.bin
usb-overdrive-14.hqx
Mac_OS_ROM_Update_1.0.smi.bin

Of course StuffIt Expander is requred to run this files.

On my Mac OS 8.6 installing these files allowed for using two button Microsoft USB mouse with with two buttons and a scroll! The work is much more comfortable now.

Sunday, March 09, 2008

Python: script for sending email

Function for sending emails using Python script. It requires local SMTP server (e.g. Postfix) or one can provide address to the external SMTP server.

def mail(From,To,subject,msg):
import smtplib

smtpserver = 'localhost' # SMTP server
AUTHREQUIRED = 0 # if you need to use SMTP AUTH set to 1
smtpuser = '' # for SMTP AUTH, set SMTP username here
smtppass = '' # for SMTP AUTH, set SMTP password here

RECIPIENTS=To
SENDER=From

mssg = """"\From: %s
Subject: %s
%s
""" %(SENDER,subject,msg)

session = smtplib.SMTP(smtpserver)
if AUTHREQUIRED:
session.login(smtpuser, smtppass)
smtpresult = session.sendmail(SENDER, RECIPIENTS, mssg)
session.quit()


if __name__ == '__main__':
subject="This is some email subject"
mssg='This is content of the mail.'
mail("return@address.com","destination@address.com",
subject,mssg)
Note: this code is based on the this article.

Wednesday, February 27, 2008

Zope: Zope page template to display image object

Lets add an image object named test.png. Now, how to display it?
Simply, create new Page Tempalte. Replace to default contents by:


This will be replace by html tag:

Monday, January 14, 2008

The solution to a system of two, first order linear differential equations is given by:
To draw this solution one can use the code for Matlab or Octave 3 provided below:
function plotDiff2D()
%p. 351, eg. 1
t=[-2:0.1:2];
cT=[-2:.5:2];

for c1=cT
for c2=cT
x1=c1*exp(3*t)+c2*exp(-t);
x2=c1*2*exp(3*t)-2*c2*exp(-t);
lineS='b-';
if c1==0 || c2==0, lineS='r-'; end
hold on; plot3(x1,x2,t,lineS);
end
end
limm=6
xlim([-limm limm]);ylim([-limm limm]);
%axis square
xlabel('x1');
ylabel('x2');
zlabel('t');
grid on;

And this script produces graphs of solution in 2D (x1,x2) and 3D (x1,x2,t):


So it is seen from these graphs that solutions of systems of two first order differential equations are very interesting, and not necessarily easy to interpret.

Thursday, January 10, 2008

Octave 3: first impression

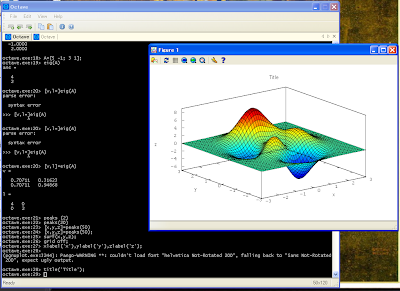
Octave 3 is out for few weeks now. I have chanced Windows binary. First impression is very positive. Installation went smooth, Octave 3 has now its own console and editor, similar to these in Matlab. 2D and 3D plotting is working:
Whats more, the problems with eigenvalues that I had with Python (see this post) does not exist in Octave 3. I have to say, that for now I have been working only with eigenvalues, inverse matrices, and multiplication of matrices. But I am encourge to use Octave 3 for longer, to other tasks, and we will see what will happen.

Update:
I found problem with 3D plots. When you draw such plot, often the plot window freezes. As a result is not possible to rotate, zoom or do any operations on the figure. Its very annoying. I use gnuplot as plot engine. I think I will try to use the other one. During installation of the Octave 3 on Windows in one point the user is asked to choose an engine plot. I should try the second one, and we will see what will happen.

Wednesday, January 09, 2008

Python: eigenvalues with Scipy and Sympy

Eigenvalues and eigenvectors are important in systems of differential equations. To speed up my analysis I decided to use some numerical package for getting eigenvalues form square matrices. I found two numerical packages Scipy and Sympy for Python. Both have ability to calculate eigenvalues. But their calculations are not reliable. I present few very simple examples showing how rubbish these packages are.

Lets see what does Python calculate:
Scipy
from scipy import *
from scipy.linalg import *

A=matrix([ [-5,-5,-9],[8,9,18],[-2,-3,-7] ])
print eigvals(A)
# [-0.999989 +1.90461984e-05j -0.999989 -1.90461984e-05j
# -1.00002199 +0.00000000e+00j]

A2=matrix([ [-5,-5,-9],[8,9,18],[-2,-3,-7] ])
print eigvals(A2)
# [-1.+0.j   -1.00000005+0.j   -0.99999995+0.j]

Sympy
from sympy import *
from sympy.matrices import Matrix
x=Symbol('x')
A=Matrix(( [-5,-5,-9],[8,9,18],[-2,-3,-7] ))
print roots(A.charpoly(x),x)
# Returns error!!!

A2=Matrix(( [-1,-3,-9],[0,5,18],[0,-2,-7] ))
print roots(A2.charpoly(x),x)
# Returns error!!!

Based on these to examples it is clearly seen that these two packaged are unreliable, at least as far as calculation of eigenvalues is considered.

For matrices 2x2 it was noticed that the eigenvalues are correctly calculated both for real and complex values.

For comparison lets check what does Matlab returns:A=[-5,-5,-9;8,9,18;-2,-3,-7]
eig(A)

ans =

-1.0000 + 0.0000i
-1.0000 - 0.0000i
-1.0000

A2=[-5,-5,-9;8,9,18;-2,-3,-7]
eig(A2)

ans =

-1.0000 + 0.0000i
-1.0000 - 0.0000i
-1.0000

So it is seen that Matlab does correctly calculate these eigenvalues.


Even if one manually calculates characteristic polynomial and would like to gets roots of it, I would recommend neither Scipy or Sympy. As an example I calculate roots of the previously obtained characteristic polynomial for matrices A and A2:
import scipy as sc
p=sc.poly1d([-1,-3,-3,-1])
print p= sc.roots(p)
# [-1.0000086 +0.00000000e+00j -0.9999957 +7.44736442e-06j
# -0.9999957 -7.44736442e-06j]
import sympy as sy
x=sy.Symbol('x')
print sy.solve(-x**3-3*x**2-3*x-1==0,x)
#[-1]

As can be seen calculation of roots of polynomials is also not good. In the second case there is one root (-1) instead of three (-1,-1,-1).

For comparison lets check Matlab (or Octave 3):p=[-1,-3,-3,-1]
roots(p)

ans =

-1.0000
-1.0000 + 0.0000i
-1.0000 - 0.0000i


Based on these results it is seen that its better to use Matlab for calculation of eignevalues.

References:
[1] S.I. Grossman, Multivariable calculus, linear algebra and differential equation, Second edition, 1986