Showing posts with label SPSS. Show all posts

Monday, March 13, 2017

Linux SPSS 24: R 3.2 was not found in this location.

When installing R essentials for linux it is unclear how to specify R path. Without this, the following error occures:

 R 3.2 was not found in this location. Please click Previous to select a different location, or install R 3.2 on this computer and run this installation again.
For me the answer was to proved a path where `lib64` of the R package is located, not where the R binary is as show on this screenshot


In the screenshot /opt/r32 is my installation folder (I compiled version 3.2.2 it myself from source). The binary R is in /opt/r32/bin. This will not work. The path must be to R folder inside lib64 folder.


Tuesday, October 27, 2015

Thursday, October 15, 2009

SPSS: create random binary variable

To create a random binary variable called e.g. new_var one can use the following code:COMPUTE new_var=RND(RV.UNIFORM(0,1)).
EXECUTE.
or

Tuesday, June 02, 2009

Paired t-test assumption of normality

It is important to remember that paired t-test is valid if the differences of pairs of variables are normally distributed. It appears that the variables itself do not need to be normally distributed, as paired t-test only operates on the differences. This observation is based on [Bland2000, p. 161 and 260].

Normality of a sample can be evaluated using Q-Q plots [Bland2000, ch. 7.5]. However, the problem with these plots is that they are not objective, i.e. for one person a sample is normally distributed, for other person the same sample may be only approximately normally distributed while for the third person it is not normally distributed. For that reason quantitative methods are better. One of such methods is Shapiro-Wilk test. The other method is Kolmogorov-Smirnov test. For small samples (i.e. 50) Shapiro-Wilk is generally more accurate [Marques2003 p.157].

If sample was found to be non Normal, Wilcoxon signed-rank test (called also Wilcoxon matched pairs test) can be used [Bland2000, ch.12.3].

All the above tests can be performed easily in SPSS.

References
Bland, Martin. An Introduction to Medical Statistics 3th ed, Oxford University Press, 2000
J. P. Marques de Sá Applied statistics: using SPSS, STATISTICA, and MATLAB, Springer, 2003

Sunday, December 21, 2008

SPSS: programing SPSS with Python (part 1)

SPSS is a data mining and statistical analysis software. Resent versions (v14 - v17) allow to use Python to control SPSS. This can be quite handy, especially if there are lots of variables and lots of data files to analyze and such analysis is often repeated. In such a case, writing some script in Python that can execute SPSS analysis automatically can save you lots of time. This is the first post out of three, which will present some example of using Python and SPSS together. First, let me present what soft and hardware I have:
  • Intel Mac X 10.4.11
  • SPSS 16.0.1 with SPSS-Python Integration Plug-In
  • Python 2.5

Check if SPSS-Python Integration Plug-In works

Before we can proceed any further we have to check if SPSS-Python Integration Plug-In is working, and we can control SPSS using Python. To do this I usually use the following procedure:
1. Start SPSS.
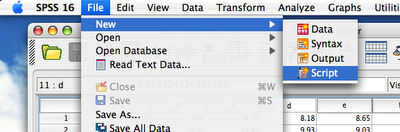
2. Create new script (File->New->Script):
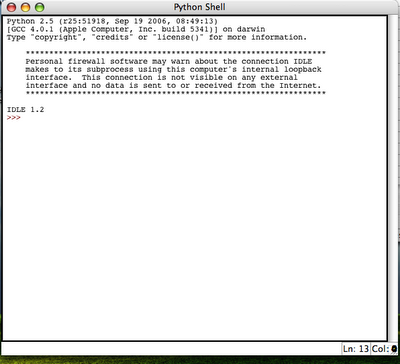
This results in a python IDLE console:
3. Try to import spss library and execute some simple spss function (e.g. spss.GetVariableCount()):
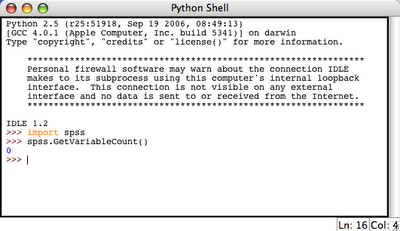
This resulted in 0 which is OK, because we do not have any active dataset.

So it appears that SPSS-Python union is working. Therefore, we can do something useful now.

Note

More information on SPSS-Python programming along with examples can be found in SPSS Programming and Data Management.

Wednesday, May 16, 2007

Mac X: Project-R

The problem with Intel Mac is that there are no software for it. Since maybe two months there is Matlab, thanks God, but I still miss SPSS, or any other statistical software different than Excel!. I have just receive an email about something called project R. I was interested by the mail; hence, I found out that it is a statistical program. I hope that it is what I was looking for, or at least will be easy to learn, on the condition that it will be nice. At the moment I'm waiting, because installation through DarwinPorts takes ages, thus I have time to write something (in fact, I have not time, but checking this new soft is just excuse from work). As soon as the installation succeed I will check it, whether it was worth installing or not.

Installation has just succeeded, although it was very, very long. Just to check it, I used an example (creation of box plots) available in a official manual:
A <- scan()
79.98 80.04 80.02 80.04 80.03 80.03 80.04 79.97
80.05 80.03 80.02 80.00 80.02

B <- scan()
80.02 79.94 79.98 79.97 79.97 80.03 79.95 79.97

boxplot(A, B)


One can see that it was very easy, and this fast test is quite encouraging to spend some more time with this R.

95% confidence interval in R:
>X1 <- scan()
1: 205 179 185 210 128 145 177 117 221 159
2: 205 128 165 180 198 158 132 283 269 204
> a <- mean(X1)
> s <- sd(X1)
> n <- length(X1)
> errZ <- qnorm(0.975)*s/sqrt(n)
> errT <- qt(0.975,df=n-1)*s/sqrt(n)
>left <- a-errT
>right <- a+errT

Sunday, February 11, 2007

SPSS+Python: First script

The below scripts reads Excel file. Than the python program pairs variables, that will be compared using paired t-test.
GET DATA
/TYPE=XLS
/FILE='/Users/marcin/Desktop/myPublicationDataAnalysis_newAniso/fs_Lud_byMarcin10/VOT/Sta_fs.xls'
/SHEET=name 'Lat'
/CELLRANGE=full
/READNAMES=off
/ASSUMEDSTRWIDTH=32767.

DATASET NAME DataSet1 WINDOW=FRONT.

BEGIN PROGRAM.
import spss
from spss import Submit

ScalesC=['V'+str(i+1) for i in range(1,10)]
ScalesOA=['V'+str(i+11) for i in range(1,10)]

for v in zip(ScalesC,ScalesOA):
c= "T-TEST PAIRS="+v[0]+" WITH "+v[1]+" (PAIRED) /CRITERIA=CI(.9500) /MISSING=ANALYSIS."
Submit(c)
END PROGRAM.