Showing posts with label Octave. Show all posts

Wednesday, November 18, 2009

Octave is getting faster!


GNU Octave "is a high-level language, primarily intended for numerical computations. It provides a convenient command line interface for solving linear and nonlinear problems numerically, and for performing other numerical experiments using a language that is mostly compatible with Matlab. It may also be used as a batch-oriented language. "

In numerical calculations speed is very important. I remember that Octave 2.x, although very useful, used to be slow. What about now when there is Octave 3.2? To answer to this question I decided to compare the time performance of this new Octave release with the performances of versions 3.0 and 2.9 using custom made benchmark script. The tests were run on Intel Mac OS X 10.4.11 (Intel Core Duo 2GHz, 2GB RAM).

 The results of 21 small tests for matrix and I/O operations are below or can be downloaded from here (gnumeric file):

The bar plot of normalized geometric mean of the 21 tests is as follows (lower is better):

The graph shows that Octave 3.2 is a bit faster than the two previous versions! Additionally, since the time values used were normalized against times obtained using MATLAB 7.4.0.287 (R2007a) on Intel Mac OS X 10.4.11 (Intel Core Duo 2GHz, 2GB RAM), it can be seen that Octave 3.2 is faster than the MATLAB R2007a. However, based on the data in the table it can be seen that the lowest performance of the Octave, as compared to Matlab is, for loop (row 13 in the table). The Octave 3.2 was nearly 700 times slower than the Matlab in execution of nested for loops! At the same time Matlab was about 1000 times slower than Octave 3.2 (but not Octave 2.9 and 3.0) in creation of sparse matrices (row 14 in the table)!!!

Should we be very excited about this! Probably not very much, since my analysis has a number of limitations. The main one is that the question whether Octave 3.2 is faster than the older versions should be answered using some real statistical approach e.g. Mann-Whiten U tests or Ordinary least products (OLP) regression analysis, influence of outliners (row 13 and 14) should be investigated etc. There is also a question whether the differences in the performance obtained are statistically significant, or whether Octave 3.2 is statistically significantly faster/slower that Matlab?

Nonetheless, I think that the results obtained clearly show a trend of increased performance for Octave.

I'm also planning to repeat the above tests for Octave 3.2, but this time with inclusion of image processing functions such as: image creation, rotation, resize, image saving etc. I could not do this for is post, because there were problems compiling image package for Octave 2.9 and 3.0 on my Mac.

Saturday, November 07, 2009

Useful Matlab / Octave script to make default function arguments easier


The lack of an easy way of making default function arguments in MATLAB (I have R2007a) was annoying me for a long time. Octave (current version 3.2), which is an open source equivalent of MATLAB is much better in terms of handling default function arguments.

What I mean, can be explained best by simple example.

So, lets define a very simple m file, called testDefaultArguments.m with the following function.
function testDefaultArguments(a=1,b=2)
fprintf(1,'a=%d, b=%d\n',a,b);
We see that we have a function called testDefaultArguments with two arguments a and b, and we assign default values to them, i.e. 1 and 2, respectively. Such syntax seems to be helpful, because you can execute testDefaultArguments function as follows:octave-3.2.3:40> testDefaultArguments()
a=1, b=2
octave-3.2.3:41> testDefaultArguments(3)
a=3, b=2
octave-3.2.3:42> testDefaultArguments(a=43)
a=43, b=2
octave-3.2.3:43> testDefaultArguments(a=43,5)
a=43, b=5
octave-3.2.3:44> testDefaultArguments(a=43,b=55)
a=43, b=55
So everything seems good, but what if you want to assign only value to b, and not to a?Lets tryoctave-3.2.3:47> testDefaultArguments(b=55)
a=55, b=2 %!!! a is 55 and not b !!! This is strange
So, this is not only strange, but can easily leads to bugs in one's code.

So this was Octave. What about MATLAB? The anwser is: Error! The function testDefaultArguments can't be executed in Matlab (at least in R2007a and R2008a) due to syntax errors!

So, to help myself with making default function arguments in both MATLAB and Octave I made getfunargs.m script, which makes working with default function arguments little easier (To be honest, this function is a modification of getargs.m script). I'm not going to explain how it works, instead I'm just going to show how it can be used.

Lets define function called testDefaultArguments2 which uses getfunargs:function testDefaultArguments2(varargin)

defaults = struct(...
'a',1,...
'b',2 ...
);

args = getfunargs(defaults, varargin);

fprintf(1,'a=%d, b=%d\n',args.a,args.b);
Now, the testDefaultArguments2 can be executed both in MATLAB and Octave as follows:octave-3.2.3:52> testDefaultArguments2()
a=1, b=2
octave-3.2.3:53> testDefaultArguments2('a',3)
a=3, b=2
octave-3.2.3:54> testDefaultArguments2('b',5)
a=1, b=5
octave-3.2.3:55> testDefaultArguments2('b',5,'a',2)
a=2, b=5
It can bee seen now, that the default arguments work as expected.

Thursday, November 05, 2009

Install Octave 3.2 with Image Processing package on Arch Linux


Octave is a great tool for programming mathematics. However, when I wanted to install it and its Image processing package on Arch Linux I got a problem: missing lgfortranbegin library.

To begin with I installed Octave using pacman as a root or sudo user (I prefer sudo)sudo pacman -Sy; pacman -S octave There was no problems with this.
Now, to install Image processing package it is necessary to do as follows:
To install a package, download the package file, and install it from the Octave prompt by typing pkg install package_file_name.tar.gz
where package_file_name.tar.gz is the name of the file you downloaded.
In my case the package_file_name.tar.gz was image-1.0.10.tar.gz and it can be downloaded form here

So, when I tried to install it I got the following erroroctave:1> pkg install image-1.0.10.tar.gz
warning: creating installation directory /usr/share/octave/packages
/usr/bin/ld: cannot find -lgfortranbegin
collect2: ld returned 1 exit status
make: *** [__spatial_filtering__.oct] Error 1
'make' returned the following error: make: Entering directory `/tmp/oct-9oWZxI/image-1.0.10/src'
mkoctfile __spatial_filtering__.cc
make: Leaving directory `/tmp/oct-9oWZxI/image-1.0.10/src'
error: called from `pkg>configure_make' in file /usr/share/octave/3.2.3/m/pkg/pkg.m near line 1253, column 2
error: called from:
error: /usr/share/octave/3.2.3/m/pkg/pkg.m at line 714, column 5
error: /usr/share/octave/3.2.3/m/pkg/pkg.m at line 287, column 7
As it can be seen lgfortranbegin is missing. The library belongs to fortran compiler and in Arch Linux it can be installed simply by sudo pacman -S gcc-fortranTo make sure that the library was installed I performed a search and I found it[marcin@arch ~]$ sudo find / -name "*fortranbegin*"
/usr/lib/gcc/i686-pc-linux-gnu/4.4.2/libgfortranbegin.a
After this there was no problems. I installed Image package as previously described and I checked if I got functions that I needed (e.g. imrotate, imresize) by: octave:1> pkg install image-1.0.10.tar.gz
octave:2> imr<tabulator>
imread imresize imrotate_Fourier
imremap imrotate
octave:2>
The installation was almost finished. I needed one more package, i.e. gnuplot to be able to display figuressudo pacman -S gnuplotFinally, I did some simple test to create an image, make a rotated version of it and display both of themoctave:8> I=randn(256);
octave:9> I2=imrotate(I,30);
octave:10> figure,imshow(I);
octave:11> figure,imshow(I2);


Conclusion

So in conclusion, to install octave along with Image package I needed to have gcc-fortran and gnuplot installed first:sudo pacman -S gcc-fortran gnuplot octaveThen follow general instruction on how to install Octave packages from here.

Wednesday, November 04, 2009

Performance benchmark script for MATLAB and Octave

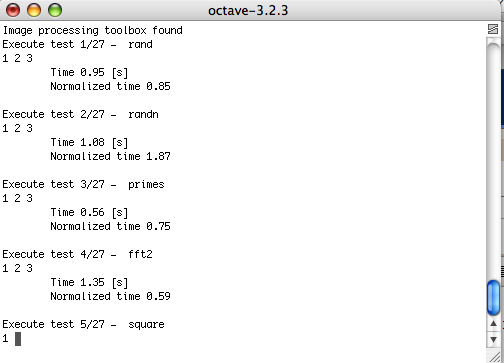
The benchmark script evaluates MATLAB and Octave not only in execution times for matrix manipulation, but also for integration, 2D interpolation, solving nonlinear equation, reading/writing files, plot creating and saving, image manipulation (e.g. rotation, filtering, erosion).

The execution times of each test (27 tests for now) are normalized against times obtained using MATLAB 7.4.0.287 (R2007a) on Intel Mac OS X 10.4.11 (Intel Core Duo
2GHz, 2GB RAM).

As a results the script generates txt file with the time values (normalized and not normalized) obtained for each test.

The evaluate overall performance of MATLAB/Octave geometric and arithmetic means of the individual time values obtained are used.

The header
function res = mybench(varargin)
% res = mybench('noOfRepeats', 3,...
% 'normalize',true,...
% 'onlyTests',[],...
% 'imagep',true)
%
% Benchmark script for MATLAB and Octave.
% Tested on Matlab 2009a and Octave 3.2.2 for Windows.
%
% Execution time of basic matrix manipulation function is tested along with
% integration, solving nonlinear equation, image processing functions ( if
% available), saving/loading matrices to a file system, for loop,
% binary operation,etc. In total 27
% tests are performed (less if image processing functions not available).
%
% All results are normalized against the results obtained
% using MATLAB 7.4.0.287 (R2007a) on Intel Mac OS X 10.4.11 (Intel Core Duo
% 2GHz, 2GB RAM)
%
% At the end, arithmetic and geometric means of the times obtained are
% calculated. All results obtained are stored in a txt file named
% results_.txt.
%
% INPUT
% noOfRepeats - int - number of times each test is executed (default 3)
% normalize - boolean - normalize results (default true).
% onlyTests - int vector - do only tests given (default [], i.e. do all tests)
% imagep - boolean - do or not image processing testing
%
% OUTPUT
% res - struct - normalized geometric mean .
%
% EXAMPLES
% res = mybench(); %perform all tests with default settings.
% res = mybench('noOfRepeats',10); %perform all tests 10 times.
% res = mybench('onlyTests',[1,5,8]); %perform only tests 1,5 and 8.
% res = mybench('noOfRepeats', 1,'normalize',false); % repeat 1 time
% %each tests and do not
% %normalize results.
%
% Site: http:\\shortrecipes.blogspot.com
% Date: Nov 2009

The full code is here.
Example output from the script is as follows:


Friday, October 30, 2009

Comparing two methods of measurement in Matalb or Octave

How to compare two methods that measure the same variable? How to check if one method produces results constantly higher than the other method and if the difference is significant? How to determine whether new method, can replace the old one? The anwser to these question lies in the analysis of bias between the two method of measurement [1]. Below is a Matlab implementation of Ordinary least products (OLP) regression analysis [1] that can be used to anwser to these questions.

function res = mgr(X,Y,varargin)
% res = mgr(X,Y)
% Mean Geometric Regression (i.e. Ordinary least products (OLP) regression)
%
% Used to evaluate two measurement methods in terms of fixed and
% proportional bias as described in [1].
%
% INPUT
% X - vector of values calculated by the first method.
% Y - vector of values calculated by the second method.
% boolean - plot or not scattergram of the values
% string - label of x axis of scattergram
% string - label of y axis of scattergram
%
%
% EXAMPLE from [1]:
%
% M1=[132 138 144 146 148 152 158 130 162 168 172 174 180 180 188 194 194 200 200 204 210 210 216 220 220];
% M2=[130 134 132 140 150 144 150 122 160 150 160 178 168 174 186 172 182 178 196 188 180 196 210 190 202];
%
% res=mgr(M1,M2)
%res =
%
% a: 13.9506
% b: 0.8611
% a_CI95: [-6.9476 32.3364]
% b_CI95: [0.7576 0.9788]
%
% res=mgr(M1,M2,true); % produces scattergram
% res=mgr(M1,M2,true,'SBP(M1)','SBP(M2)'); % produces scattergram with x and y axis
% % labels of 'SBP(M1)' and 'SBP(M2)'
%
% NOTE:
% The above calculated values of a and b agree with the values in [1]
% Values of CI95 are marginally different, becouse, as expalined in [1],
% they are calculated using approximate formulas.
%
%REFERENCE:
%[1] J Ludbrook, Comparing methods of measurement, Clinical and
% Experimental Pharmacology and Physiology, 1997:24,193-203
%
%
%
Full code of the above script is here.
Script was tested on Matlab 2007a and in Octave 3.2. En example of the scattergram that is generated by the script is below. This scattergram is the same as an example given in [1].

References

[1] J Ludbrook, Comparing methods of measurement, Clinical and Experimental Pharmacology and Physiology, 1997:24,193-203.

Thursday, January 10, 2008

Octave 3: first impression

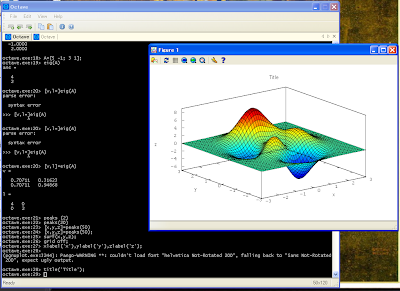
Octave 3 is out for few weeks now. I have chanced Windows binary. First impression is very positive. Installation went smooth, Octave 3 has now its own console and editor, similar to these in Matlab. 2D and 3D plotting is working:
Whats more, the problems with eigenvalues that I had with Python (see this post) does not exist in Octave 3. I have to say, that for now I have been working only with eigenvalues, inverse matrices, and multiplication of matrices. But I am encourge to use Octave 3 for longer, to other tasks, and we will see what will happen.

Update:
I found problem with 3D plots. When you draw such plot, often the plot window freezes. As a result is not possible to rotate, zoom or do any operations on the figure. Its very annoying. I use gnuplot as plot engine. I think I will try to use the other one. During installation of the Octave 3 on Windows in one point the user is asked to choose an engine plot. I should try the second one, and we will see what will happen.