Please install this soft:
GameSprockets_1.7.5.smi.bin
usb-overdrive-14.hqx
Mac_OS_ROM_Update_1.0.smi.bin
Of course StuffIt Expander is requred to run this files.
On my Mac OS 8.6 installing these files allowed for using two button Microsoft USB mouse with with two buttons and a scroll! The work is much more comfortable now.
Wednesday, March 26, 2008
Sunday, March 09, 2008
Python: script for sending email
Function for sending emails using Python script. It requires local SMTP server (e.g. Postfix) or one can provide address to the external SMTP server.
def mail(From,To,subject,msg):
import smtplib

smtpserver = 'localhost' # SMTP server
AUTHREQUIRED = 0 # if you need to use SMTP AUTH set to 1
smtpuser = ''  # for SMTP AUTH, set SMTP username here
smtppass = ''  # for SMTP AUTH, set SMTP password here

RECIPIENTS=To
SENDER=From

mssg = """"\From: %s
Subject: %s
%s
""" %(SENDER,subject,msg)

session = smtplib.SMTP(smtpserver)
if AUTHREQUIRED:
   session.login(smtpuser, smtppass)
smtpresult = session.sendmail(SENDER, RECIPIENTS, mssg)
session.quit()


if __name__ == '__main__':
subject="This is some email subject"
mssg='This is content of the mail.'
mail("return@address.com","destination@address.com",
subject,mssg) 
Wednesday, February 27, 2008
Zope: Zope page template to display image object
Lets add an image object named test.png. Now, how to display it?
Simply, create new Page Tempalte. Replace to default contents by:

This will be replace by html tag:

Simply, create new Page Tempalte. Replace to default contents by:

This will be replace by html tag:

Monday, January 14, 2008
The solution to a system of two, first order linear differential equations is given by:
 To draw this solution one can use the code for Matlab or Octave 3 provided below:
And this script produces graphs of solution in 2D (x1,x2) and 3D (x1,x2,t):


| function plotDiff2D() %p. 351, eg. 1 t=[-2:0.1:2]; cT=[-2:.5:2]; for c1=cT for c2=cT x1=c1*exp(3*t)+c2*exp(-t); x2=c1*2*exp(3*t)-2*c2*exp(-t); lineS='b-'; if c1==0 || c2==0, lineS='r-'; end hold on; plot3(x1,x2,t,lineS); end end limm=6 xlim([-limm limm]);ylim([-limm limm]); %axis square xlabel('x1'); ylabel('x2'); zlabel('t'); grid on; |
So it is seen from these graphs that solutions of systems of two first order differential equations are very interesting, and not necessarily easy to interpret.
Thursday, January 10, 2008
Octave 3: first impression
Octave 3 is out for few weeks now. I have chanced Windows binary. First impression is very positive. Installation went smooth, Octave 3 has now its own console and editor, similar to these in Matlab. 2D and 3D plotting is working:
 Whats more, the problems with eigenvalues that I had with Python (see this post) does not exist in Octave 3. I have to say, that for now I have been working only with eigenvalues, inverse matrices, and multiplication of matrices. But I am encourge to use Octave 3 for longer, to other tasks, and we will see what will happen.
Update:
I found problem with 3D plots. When you draw such plot, often the plot window freezes. As a result is not possible to rotate, zoom or do any operations on the figure. Its very annoying. I use gnuplot as plot engine. I think I will try to use the other one. During installation of the Octave 3 on Windows in one point the user is asked to choose an engine plot. I should try the second one, and we will see what will happen.
Wednesday, January 09, 2008
Python: eigenvalues with Scipy and Sympy
Eigenvalues and eigenvectors are important in systems of differential equations. To speed up my analysis I decided to use some numerical package for getting eigenvalues form square matrices. I found two numerical packages Scipy and Sympy for Python. Both have ability to calculate eigenvalues. But their calculations are not reliable. I present few very simple examples showing how rubbish these packages are.
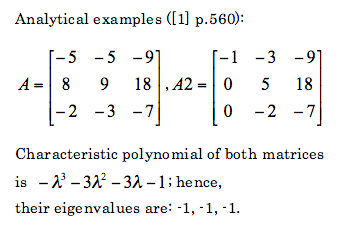
Lets see what does Python calculate:
Scipy
Sympy
Based on these to examples it is clearly seen that these two packaged are unreliable, at least as far as calculation of eigenvalues is considered.
For matrices 2x2 it was noticed that the eigenvalues are correctly calculated both for real and complex values.
For comparison lets check what does Matlab returns:
So it is seen that Matlab does correctly calculate these eigenvalues.
Even if one manually calculates characteristic polynomial and would like to gets roots of it, I would recommend neither Scipy or Sympy. As an example I calculate roots of the previously obtained characteristic polynomial for matrices A and A2:
As can be seen calculation of roots of polynomials is also not good. In the second case there is one root (-1) instead of three (-1,-1,-1).
For comparison lets check Matlab (or Octave 3):
Based on these results it is seen that its better to use Matlab for calculation of eignevalues.
References:
[1] S.I. Grossman, Multivariable calculus, linear algebra and differential equation, Second edition, 1986

Lets see what does Python calculate:
Scipy
from scipy import *
from scipy.linalg import *

A=matrix([    [-5,-5,-9],[8,9,18],[-2,-3,-7]  ])
print eigvals(A)
# [-0.999989   +1.90461984e-05j -0.999989   -1.90461984e-05j
# -1.00002199 +0.00000000e+00j]

A2=matrix([    [-5,-5,-9],[8,9,18],[-2,-3,-7]  ])
print eigvals(A2)
# [-1.+0.j   -1.00000005+0.j   -0.99999995+0.j]
Sympy
from sympy import *
from sympy.matrices import Matrix
x=Symbol('x')
A=Matrix((     [-5,-5,-9],[8,9,18],[-2,-3,-7]  ))
print roots(A.charpoly(x),x)
# Returns error!!!

A2=Matrix((      [-1,-3,-9],[0,5,18],[0,-2,-7]  ))
print roots(A2.charpoly(x),x)
# Returns error!!!
Based on these to examples it is clearly seen that these two packaged are unreliable, at least as far as calculation of eigenvalues is considered.
For matrices 2x2 it was noticed that the eigenvalues are correctly calculated both for real and complex values.
For comparison lets check what does Matlab returns:
A=[-5,-5,-9;8,9,18;-2,-3,-7]
eig(A)

ans =

-1.0000 + 0.0000i
-1.0000 - 0.0000i
-1.0000

A2=[-5,-5,-9;8,9,18;-2,-3,-7]
eig(A2)

ans =

-1.0000 + 0.0000i
-1.0000 - 0.0000i
-1.0000
So it is seen that Matlab does correctly calculate these eigenvalues.
Even if one manually calculates characteristic polynomial and would like to gets roots of it, I would recommend neither Scipy or Sympy. As an example I calculate roots of the previously obtained characteristic polynomial for matrices A and A2:
import scipy as sc
p=sc.poly1d([-1,-3,-3,-1])
print p= sc.roots(p)
# [-1.0000086 +0.00000000e+00j -0.9999957 +7.44736442e-06j
# -0.9999957 -7.44736442e-06j]
import sympy as sy
x=sy.Symbol('x')
print sy.solve(-x**3-3*x**2-3*x-1==0,x)
#[-1]
As can be seen calculation of roots of polynomials is also not good. In the second case there is one root (-1) instead of three (-1,-1,-1).
For comparison lets check Matlab (or Octave 3):
p=[-1,-3,-3,-1]
roots(p)

ans =

-1.0000
-1.0000 + 0.0000i
-1.0000 - 0.0000i
Based on these results it is seen that its better to use Matlab for calculation of eignevalues.
References:
[1] S.I. Grossman, Multivariable calculus, linear algebra and differential equation, Second edition, 1986
Sunday, December 02, 2007
Python Imaging Library - not working with 16 bit images
Python Imaging Library works well with 8-bit images, however it has problem with 16-bit images. As an example I wrote a script that flops tiff images horizontally. One image is 8-bit and the second image is 16-bit:


The result of the above code is:


It is clearly seen that flopping 16-bit image gives wrong results.


#!/usr/bin/env python
'''
Convert tif images from Ludvig 2008.

This scripts take all tifs in input dir, and changes
tif files into tiff. Additionali it takes
right knee x-rays and flips them horizontally,
to have all x-ray in the same format.

'''
#from myUtil import *
import re
import os
import Image
import Tkinter, tkFileDialog, os.path
from scipy import *

def flip_horizontally(inDir,inFile,outFile=None):
imgpath=inDir+inFile
im = Image.open(imgpath)
out = im.transpose(Image.FLIP_LEFT_RIGHT)
if outFile is None: outFile=inFile
base=os.path.splitext(outFile)[0]
out.save(inDir+base+'_flopped.tiff')

def main():
inDir=myGetDir('./')
print inDir
files=os.listdir(inDir)
#change_file_ext(inDir,r'\.tif+$','.tiff')
for f in files:
if f.find('tiff')==-1: continue
if f.find('test')==-1: continue
print f
flip_horizontally(inDir,f,f)

def myGetDir(indir='./',putTitle='Select dir'):
"""Get one dir name"""
root = Tkinter.Tk()
root.withdraw()
dirr=tkFileDialog.askdirectory(initialdir=indir,
title=putTitle)
if len(dirr)==0:  exit(1)
return dirr+'/'

if __name__ == '__main__':
main()
The result of the above code is:


It is clearly seen that flopping 16-bit image gives wrong results.
Thursday, November 29, 2007


Friday, November 16, 2007
Matlab: Easter egg - spy
In Matlab, spy(S) function plots the sparsity pattern of the matrix S. But if you run spy without any arguments you get:
 Interesting, isn't it:-)
 Interesting, isn't it:-)
Monday, August 27, 2007
Subscribe to:
Posts (Atom)